Using OpenRefine to Report on Cataloging Statistics in Millennium
¡HACK ALERT! Millennium is a great ILS…. and it is also immensely frustrating to use as a cataloger in so so many ways. It doesn’t seem to be long for this world (Berkeley is going whole hog into the UC system-wide ILS search), so this post presents a kind of à propos band-aid-hack that I have been using for a couple of years to get around some statistics limitations in Millennium.
CreateLists is terrible
The PFA library (“the UC Berkeley Art Museum and Pacific Film Archive Film Library and Study Center” aka TUCBAMAPFAFLASC) is an affiliated library in the UC Berkeley library system, which means that we use Millennium as our Integrated Library System (ILS) and catalog into UCB’s OskiCat. This is both great and really terrible since Millennium has an interface and user functionality that are stuck in 1997:
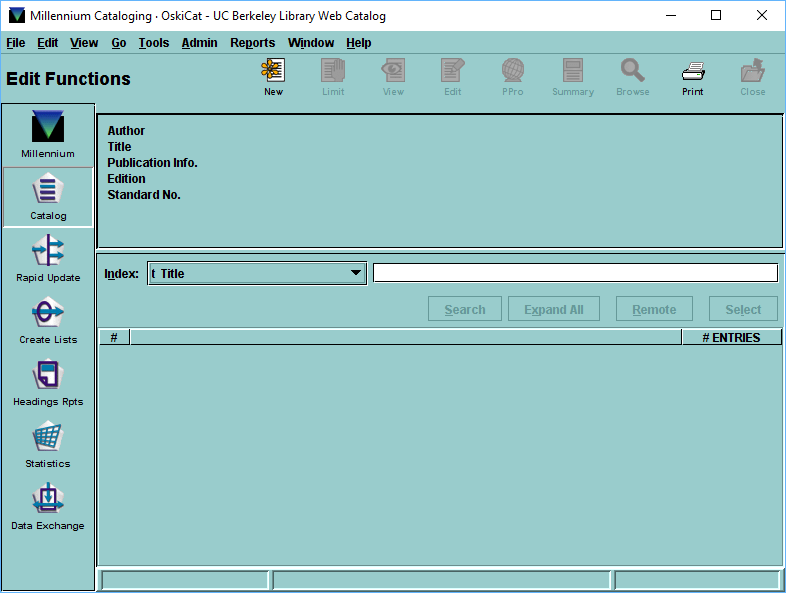
The UI of a workhorse. An ugly, ugly workhorse.
The main way that we interact with our records in bulk is through the “Create Lists” function within Millennium, which is a really crazy means of gathering records according to a pretty limited set of data points:
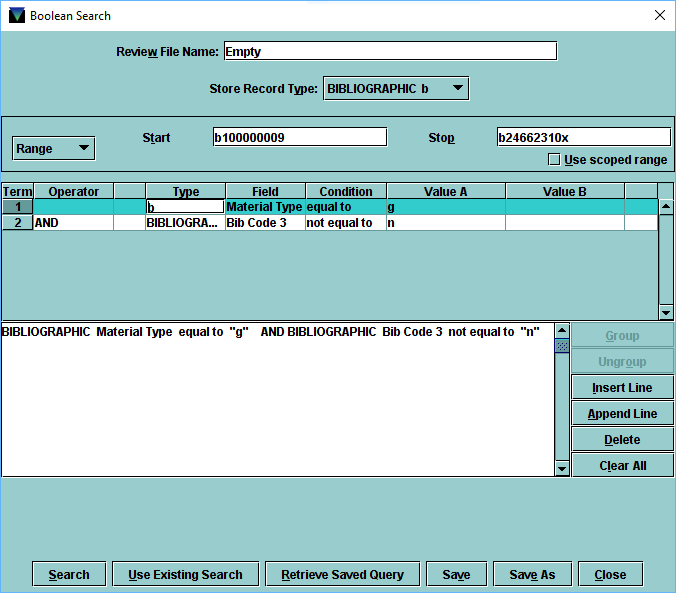
CreateLists is terrible
Basically it helps you construct a (potentially very long) Boolean search to match the records you are interested in. I could go on and on about the limitations of this system (for starters there are only 100 “review files” that can be used at any given time, and 1/4 of them are reserved for use by the Systems Office to run scheduled batch processes, and each file is limited to a maximum number of records that can be included in the return set, oh and only one user can use a review file at a time; so maybe if you’re lucky there will be an available file to run your search), but suffice it to say that in itself it is totally inadequate to do things like analyze statistics. At least I haven’t figured out a reasonable way to do it.
Which is where OpenRefine comes in
One really key suggestion that came from the UCB Main Library cataloging department is that all staff should use a 956 field to record a bit of data for statistics each time that a record is created or modified in any meaningful way. This is done in a structured and regular way to provide a more reasonable means to then gather statistics when the time comes. Subfield $a includes a structured date element, $b includes the cataloger’s initial code, and $c includes a code from a list that includes things like “CO” for original cataloging, “CCS” for copy cataloging with subject analysis, “MR” for regular maintenance, and “MA” for advanced maintenance.

Example of a 956 stats entry on a bibliographic record
Helpfully, it’s easy to use a macro to insert an “MR” 956 entry. I have this one assigned to F1:
%CTRL+SHIFT+e%%PGDW%%ENTER%y956%TAB%%date |bpfmcq|cMR
Rolls right off the tongue. Anyway, the reporting that I need to do is typically to my boss for granting agencies who support the cataloging efforts of the PFA. This usually just means tabulating the number of films and then the number of print-based items that were added to the catalog during either a calendar year or a fiscal year (in our case that’s July 1 - June 30 the following calendar year). I also report on records that were enhanced (either “MR” or “MA”).
One useful part of Millennium is that you can export all the records in your CreateLists find set as a tab- or comma-delimited text file. Which means that I can export all of our records (we have thousands of records, not hundreds of thousands like Main…) and forget about Millennium as I process my neat text file somewhere else.
<DIGRESSION> I really wish that Millennium had an API like more modern ILS-es like the Ex Libris Alma system that also does stuff like export MARCXML. Sigh. </DIGRESSION>
If you are not familiar with OpenRefine and yet you are reading this post, you should definitely get yourself a little familiar with it. It’s an awesome tool for working with large batches of structured textual (and numerical?) data. There are insane things you can do with Linked Open Data, reconciliation against various ontologies, cleaning messy data, and… I find that it’s a handy tool for my statistics gathering (among other things). I won’t go into the process of setting up OpenRefine or opening a project, but I can say both are quite painless (especially on Mac) and there are demos/FAQ/etc. on the OpenRefine github. Basically once you have it installed you just create a project, select a few options for things like which delimiter and text encoding to use (the defaults tend to be good/correct), and have at it within a few seconds.
An important conceptual sidenote: Millennium has two types of records that are relevant here: item records that pertain to a single copy of a book or a film print, and bibliographic records that include the static information related to (in principle) every copy of a given edition of a work. Item records are attached to bib records and are more or less “mobile”–you can have a bib record with no items, but not vice versa. Bib records are created in OCLC as “master records” including things like authors/directors (MARC 100/700/etc. fields), subjects (600/650/etc.), and physical carrier information (3xx fields).
I start my stats process with an export from Millennium that includes a row for every item with PFA as the owning branch. Again, I find that it’s simpler and ultimately more useful to include ALL THE RECORDS in my export and forget about Millennium once I have my raw data. This export includes a set of fields that I have found are useful for the kind of analysis I do–the 956 field mentioned above (which is recorded on the bib record), the item record number, the item record call number, the item created date, and a few other bits and bobs.
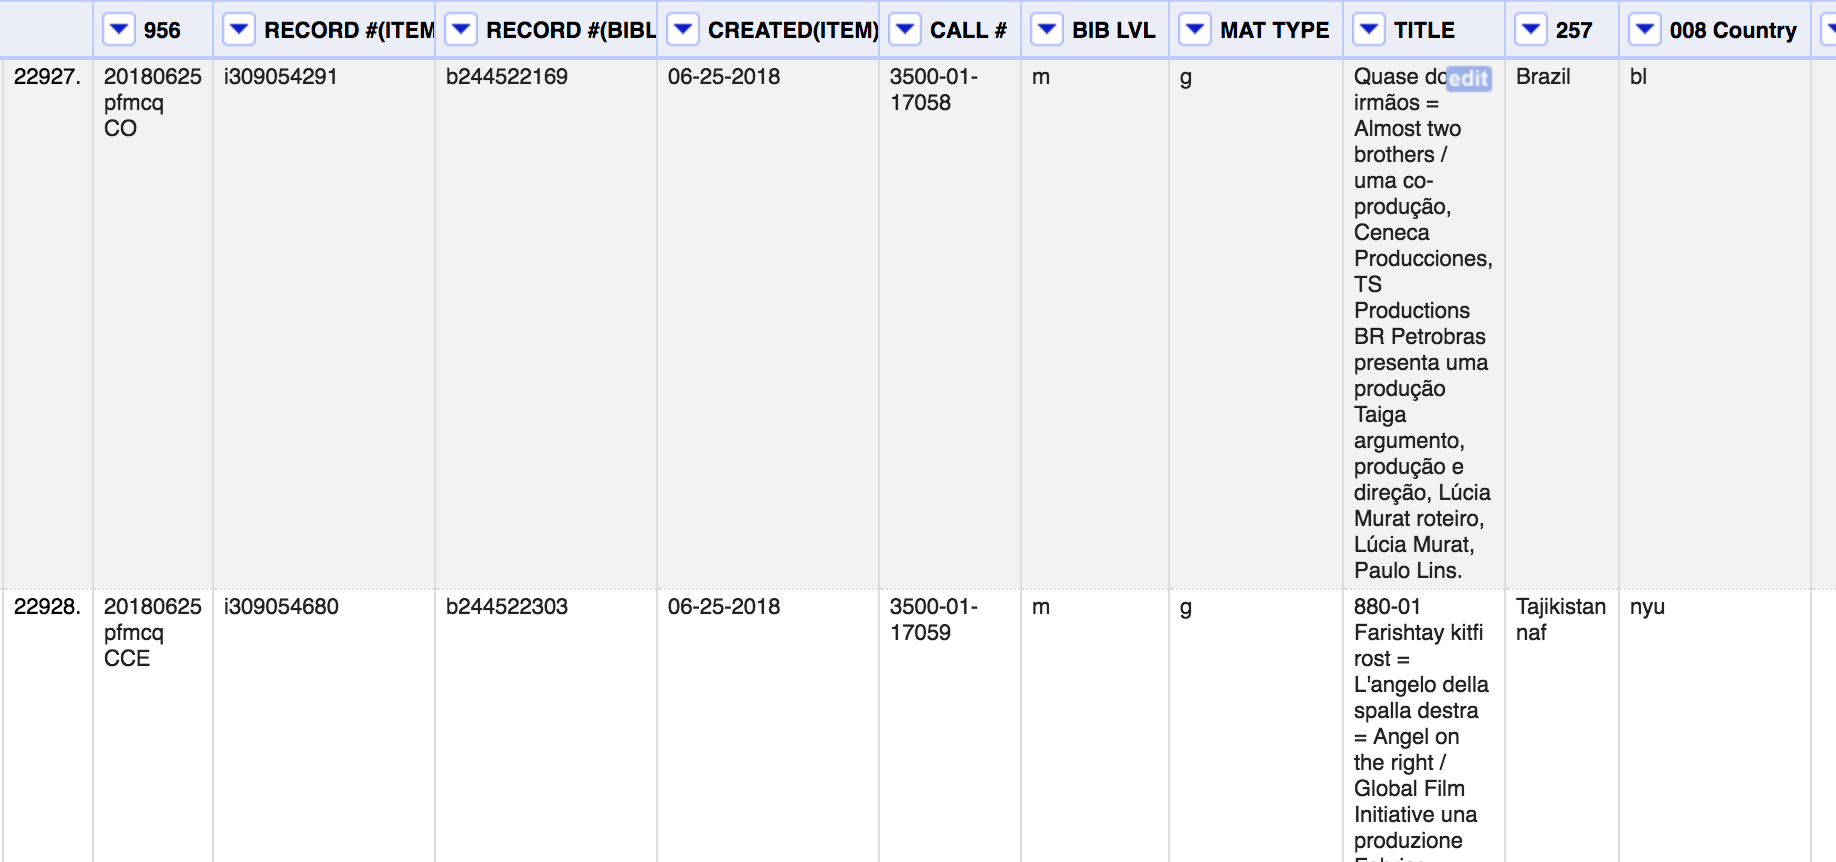
One row represents an item record in Millennium
You can see that each item gets a row in the OpenRefine display. The magic will happen with the dropdown arrow at the top of each column. We are interested in faceting the data in various columns so that we can retrieve subsets of our data. Behold the power of OpenRefine!
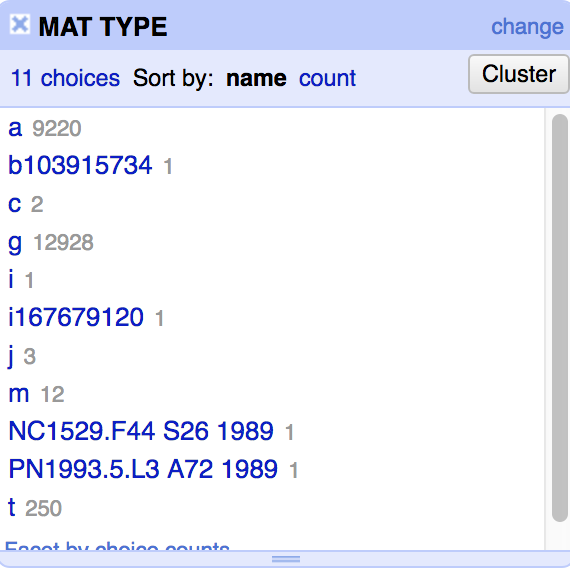
Simple text facet of the MATERIAL TYPE column
Facets in OpenRefine are a way to view or select a subset of your data based on some characteristic of the values in a column. The simplest example is “Text facet,” which takes the text values of every cell in a column and provides you with a grouping of each time a particular unique value is found. This is really helpful if you have many data points with a few possible values, but much less helpful if each of your values is unique (if you try to throw thousands of values at it, OpenRefine will complain and tell you to go away). For example, in my item record export I have about 25,000 rows, but the “MATERIAL TYPE” column is limited to the MARC values a/t/m/g/c/e/j/etc/etc defined here. For me it’s simple since the vast majority of our collection is either “a” (print material) or “g” (projected medium, aka film or video). I can select “Text facet” and in the sidebar that comes up, click on “g” to view all the film records. Neat!
LOL at least that’s how it’s supposed to work. In the example above, you can see some bibliographic record numbers and some call numbers in this selection because Millennium doesn’t always export records consistently (garbage in, garbage out). As far as I can tell if an item is attached to more than one bib record (for example, an item can be linked to a record for a compilation and to a record for the work cataloged as a monograph) it screws Millennium up when it tries to export them all.
Custom text facets
Custom text facets on the other hand let you control what you are looking for rather than the blunt instrument of “show me all the values.” Under the Facet submenu you can choose ‘Custom Text Facet… ‘
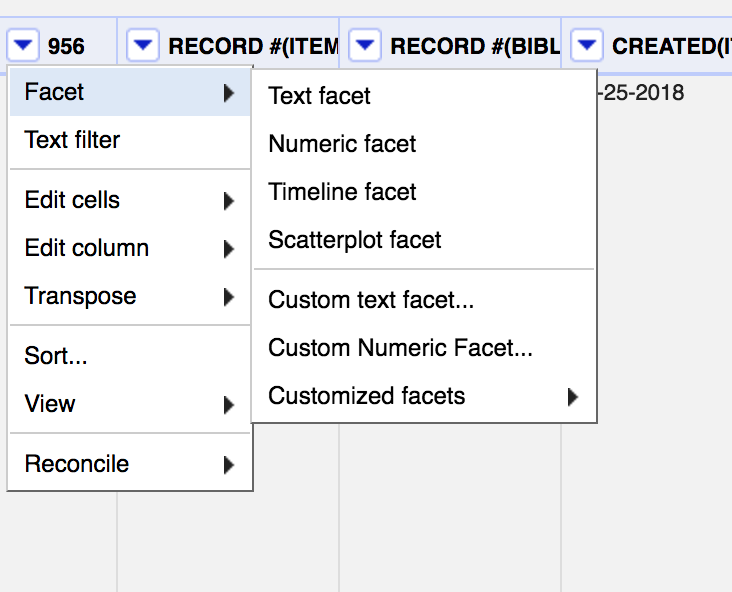
From the menu that appears you can write an expression that will facet all the values in your column based on whatever details suit your needs.
There is a special “expression language” for OpenRefine called GREL (Google Refine Expression Language, a holdover from when OpenRefine was a Google-sponsored project) that allows you to construct expressions that manipulate, analyze, or transform the data in a cell or a group of cells such as a column or row. Importantly for my use case, it also allows you to use regular expressions to match or identify patterns that you want to isolate in your data.
I am interested finding patterns in the 956 fields in my data that will match records created or modified over a given time period. For example, records from calendar year 2018 will have a 956 delimeter a between $a20180101 and $a20181231, while fiscal 2017-2018 will be between $a20170701 and $a20180630. This allows me to do things in GREL like
isNotNull(value.match(/.*((2017)(07|08|09|10|11|12)|(2018)(01|02|03|04|05|06|))(\d{2})(\ |\ \ )pfmcq\ M.*/))
which matches any record modified in any of the months of the fiscal year 2017-2018. The regular expression I used here is a kind of brute-force approach that looks for one of the 12 possible combinations of 2017+month or 2018+month. More sophisticated approaches are possile (you can convert the date data into a specific date data type, for example), but I have found them less reliable in part because of the inconsistency of data exported from Millennium.
The expression isNotNull returns either True or False so when I run this custom text facet on my 956 column I get many thousands of False results, and a smaller subset of True results, which is my total for the statistics that I need to report.
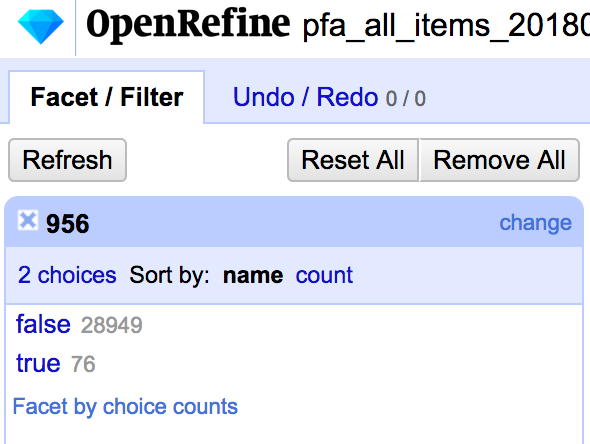
That’s kind of it… The rest of my statistics are gathered with a variety of similar regular expressions. I then just tally up the numbers and write them into my report.
Conclusion
This kind of workaround is not ideal, for one thing because of how unreliable the data exports from Millennium can be. It is, however more reliable than trying to use regular expressions and identify the correct records in Millennium directly. To be fair, from what I understand the systems librarians in the Main library use CreateLists and maybe some Perl scripts to compile statistics for Main and some of the subject libraries. I still don’t know exactly what they do, but if I find out I will post it here!
Note:
I wrote the first draft this post a couple of months ago and was still using OpenRefine version 2 point something. I revisted the topic recently and now I have version 3.1. There’s a bug in this version having to do with data types (actually it’s less of a bug than a change in how OR deals with different types of data) which won’t give you the True/False results I mention above, but instead it will just say (boolean). Apparently there will be a fix in the next version but as of January 2019 you can just add .toString() to the end of the GREL expression above and the raw True/False Boolean data will be converted to the actual text “True” or “False” and the text facet will work as pictured here. Meh.